








Short answer: nominal battery Wh and measured output Wh describe different boundaries. A delivered-energy result is useful only when the test names the output path, meter location, load, starting state and stopping point. A partial-session reading is not usable capacity, and a charger-input reading is not energy delivered to your device.
For a European buyer reading reviews or preparing a low-risk device setup, the most useful question is often “What did the meter include?” This guide explains that question before assigning a percentage. It contains no hands-on result or measured loss figure for any FlashFish model.
In this guide: Choose the boundary · Explain the gap · Three examples · Copy the report card · FAQ
Choose the boundary before calculating a ratio
A watt describes power; a watt-hour describes energy accumulated over time. For a constant 20W load over 3 hours, the arithmetic is 60Wh. This is an illustrative calculation, not a measurement of a station. NIST’s SI guidance supports making the quantity and unit explicit; a number without its meaning and location is a weak comparison.
| Quantity | What it describes | What it cannot establish alone |
|---|---|---|
| Nominal battery Wh | The manufacturer’s declared label-energy basis | Delivered output energy for your device |
| AC outlet Wh | Energy crossing the downstream AC meter | Internal station overhead or cell energy |
| USB-path Wh | Energy crossing the specified USB meter | Every port, profile or downstream battery gain |
| Charger-input Wh | Energy entering the charging system at that meter | Energy later delivered through an output |
| Partial-session Wh | Energy for the recorded task interval | Complete usable capacity or battery health |
Draw a small diagram for each result: source → conversion stage → meter → device. If the meter moves, the meaning moves. At an AC outlet it includes the downstream adapter and device demand. At a USB cable it sees that cable’s power path. At a wall charger it sees charging energy and possibly concurrent operation; those readings are not interchangeable.
Why delivered energy can differ from the label
The path from stored battery energy to a useful task can involve DC conversion, an inverter, an external adapter and the device’s own charging electronics. Station control, display and cooling can also use energy. A downstream meter cannot separately tell you how much each internal stage used.
The available operating window and stopping procedure also matter. A test that stops when the display reaches a chosen level covers a different interval from a test that stops when the output turns off. Temperature, load behaviour and charging taper can change the result. None of this supplies a universal loss percentage or authorises a user to override protection.
For USB-C, USB-IF’s Power Delivery overview explains negotiated power. Record the actual route and compatible equipment. A meter must support the required profile and remain within its ratings; adding an unsuitable meter can change negotiation or create a new failure. Its presence does not establish an accurate, transparent test.
Three hypothetical readings that mean different things
| Example | Correct interpretation | Incorrect conclusion |
|---|---|---|
| An enclosed AC meter records 60Wh during one task | That task used 60Wh downstream at the stated AC boundary | The entire station has 60Wh usable capacity |
| A charging-input meter records 220Wh during recharge | 220Wh crossed that input boundary in those conditions | The station will deliver 220Wh to a laptop |
| A documented complete output test reports 300Wh against a 384Wh nominal label | 300 ÷ 384 is about 78.1% for that test boundary and procedure | Every 384Wh station or every output route has 78.1% efficiency |
All three figures are hypothetical. The third ratio is better named “output energy relative to nominal label energy under this procedure.” It is not automatically inverter efficiency: nominal energy is not a measured inverter-input value. If the starting state, endpoint or conditions are missing, withhold the comparison rather than letting a tidy percentage hide uncertainty.
Copy this test-report card
| Required entry | What to write down |
|---|---|
| Product identity | Exact model, regional variant, firmware if available and nominal label Wh |
| Boundary | AC outlet, USB cable or charging input; draw the meter position |
| Equipment | Meter model, documented range/capability, cables and approved adapters |
| Starting state | Display state, charging condition and any manufacturer-required preparation |
| Load | Exact device, settings and task; distinguish steady and changing demand |
| Conditions | Ambient temperature, output mode and whether anything else was connected |
| Endpoint | Session end, chosen reserve, normal shutdown or another defined event |
| Result | Accumulated Wh, duration and any warnings, interruptions or reset |
| Coverage | Partial task or complete declared procedure; observations and remaining unknowns |
A result with these entries is easier to assess than an unexplained efficiency badge. A repeat can reveal variability only when conditions and boundaries are comparable. Keep original records and report discrepancies; do not choose the most flattering run or convert an isolated number into a reliability ranking.
A sensible consumer measurement boundary
For a low-risk task, use only compatible, enclosed consumer meters and approved leads within their published limits. Run a representative session under supervision and stop normally with your planned reserve. This guide does not ask you to run a battery to protective cutoff, open its case, probe cell wiring or measure exposed mains contacts.
- Check the station, device and meter instructions before inserting measurement equipment.
- Keep simultaneous inputs and outputs out of a simple comparison unless their contribution is measured and reported.
- Separate measured values from display estimates and notebook calculations.
- Stop on damage, abnormal heating, warnings, unstable output or repeated disconnects.
- For a suspected product fault, send the log to support instead of declaring cell failure from one downstream reading.
How the distinction applies to FlashFish
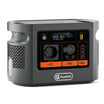
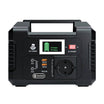
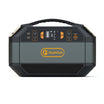
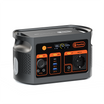
The authoritative local database lists 179.2Wh for E103 and 384Wh for E106B. It does not provide measured delivered-energy data for this guide. These figures can help screen a category, but we cannot assign either model an output-energy value, loss percentage or runtime from the label alone.
FlashFish can fit a user who accepts the exact model’s verified connections and limitations and checks a real task with an honest measurement boundary. It does not fit a decision that requires a certified minimum delivered-energy result which has not been supplied. Ask for a transparent procedure and evidence before relying on such a requirement.
Common mistakes that weaken a comparison
Do not compare one review’s USB result with another’s AC result as though the paths were equal. Do not compare a short light-load session with a complete high-load test as if both measured usable capacity. Do not treat a wall-recharge measurement as a battery-cell measurement. The remedy is to fix the boundaries and procedure, not invent a correction factor.
Frequently asked questions
Is nominal Wh the same as delivered AC Wh?
No. Nominal Wh describes the battery label basis. Delivered AC Wh is measured at a specified AC boundary, under a stated load and start/stop procedure.
Can a plug-in meter measure energy used by the station itself?
A meter after the station’s AC outlet measures downstream AC energy. It does not separately measure the station’s internal inverter, control or cooling consumption.
Can I use charger-input Wh as delivered-energy Wh?
No. A meter at the station’s charging input includes the charging path and any concurrent loads. It measures a different boundary from the energy delivered to a device.
Does a partial-session reading show the station’s usable capacity?
No. A partial session covers only that session and its stated conditions. It is not a complete usable-capacity test or a diagnosis of the cells.
Can I compare AC and USB-C results directly?
Only after stating their different boundaries and test conditions. A USB meter can also affect negotiation, so verify the exact meter’s capability and document the power path.
Use measurements to answer the actual task
First decide whether you are recording task energy, interpreting a complete output test or evaluating charging input. Then compare like boundaries and state the remaining unknowns. A well-described partial task can be useful for planning without pretending to be a full capacity test.
Next step: Compare station labels with your own measured task.
Sources and method
Prepared by FlashFish Miles. Evidence checked 17 September 2026. Product labels use the authoritative local product database and linked Europe collection. NIST supports measurement language; USB-IF supports the negotiated-power context. The examples and report card are analytical tools. No FlashFish efficiency, capacity diagnosis, meter validation, physical test, customer quote or runtime is claimed.





Leave a comment
Este site está protegido pela Política de privacidade da hCaptcha e da hCaptcha e aplicam-se os Termos de serviço das mesmas.